Linear Regression in Real Life
This post was written by Carolina Bento. She leads Data Analytics teams that empower companies to make data-driven decisions, and currently manages Product Analytics team at eero. This article was originally posted on Medium, and has been reposted with permission.
We learn a lot of interesting and useful concepts in school but sometimes it's not very clear how we can use them in real life.
One concept/tool that might be widely underestimated is Linear Regression.
(You may also be interested in a related topic: regression vs. correlation).
Say you’re planning a road trip to Las Vegas with two of your best friends. You start off in San Francisco and you know it’s going to be a ~9h drive. While your friends are in charge of the party operations you’re in charge of the all the logistics involved. You have to plan every detail: the schedule, when to stop and where, make sure you get there on time ...
So, what’s the first thing you do? You sneakily disappear from the face of the Earth and stop answering your friends calls, because they’ll have fun while you’ll be the party police?! No, you get yourself a blank sheet of paper and start planning!
First item on your checklist? Budget! It’s a 9h — approximately 1200 miles— fun ride, so a total of 18h on the road. The follow-up question: How much money should I allocate for gas?
This is a very important question. You don't want to stop in the middle of the highway and possibly walk a few miles just because you ran out of gas!
How much money should you allocate for gas?
You approach this problem with a science-oriented mindset, thinking that there must be a way to estimate the amount of money needed, based on the distance you're travelling.
First, you look at some data.
You've been laboriously tracking your car’s efficiency for the last year — because who doesn’t! — so somewhere in your computer there's this spreadsheet
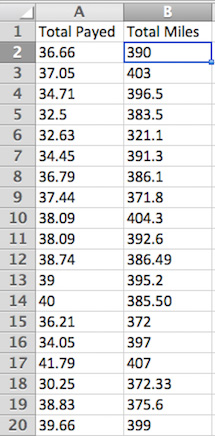
At this point these are just numbers. It's not very easy to get any valuable information from this spreadsheet.
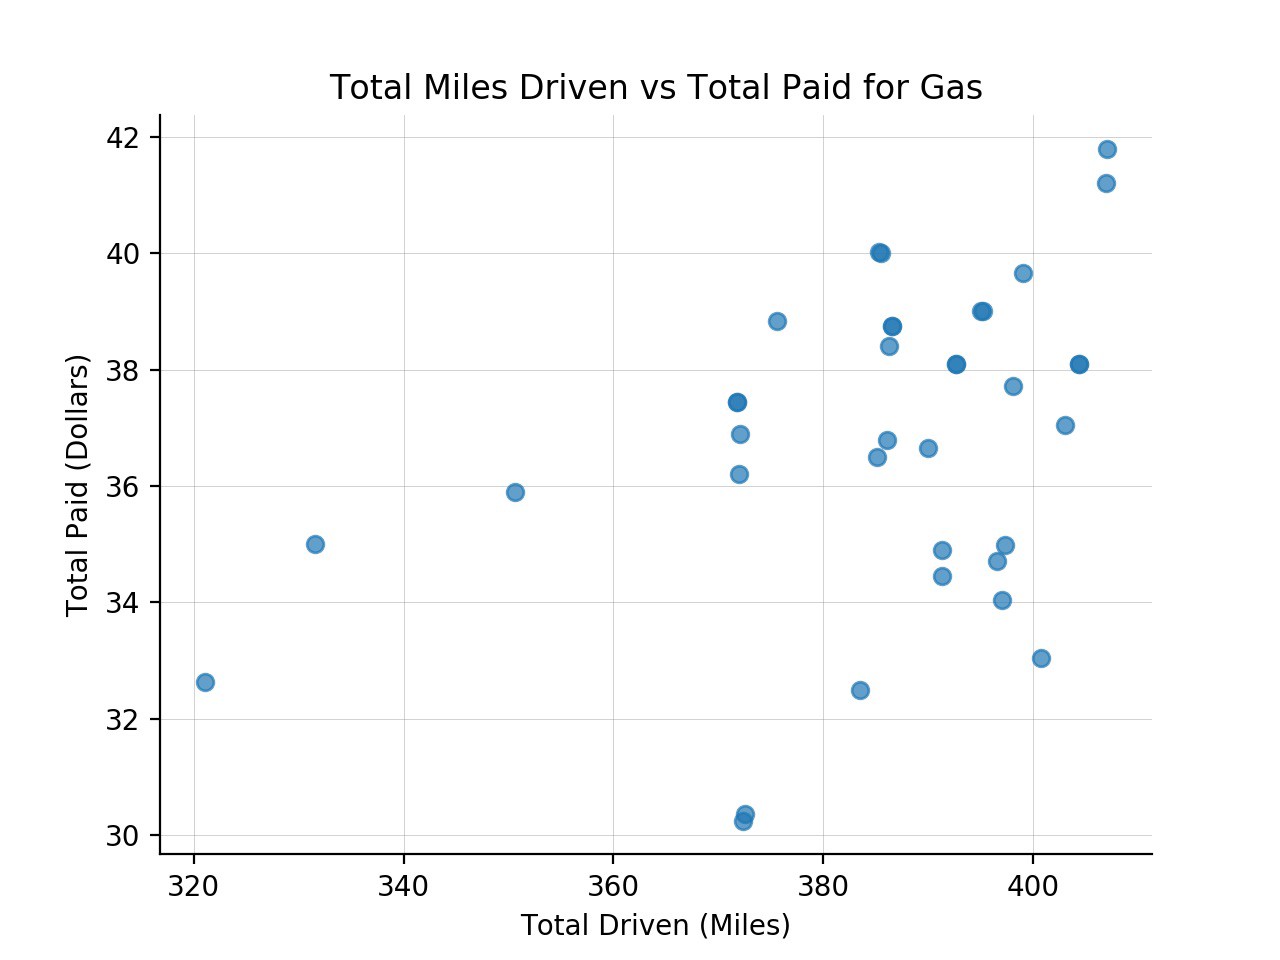
However, plotted like this it's clear that there is some "connection" between how far you can drive without filling the tank. Not that you didn't know that already but now — with data — it becomes clear.
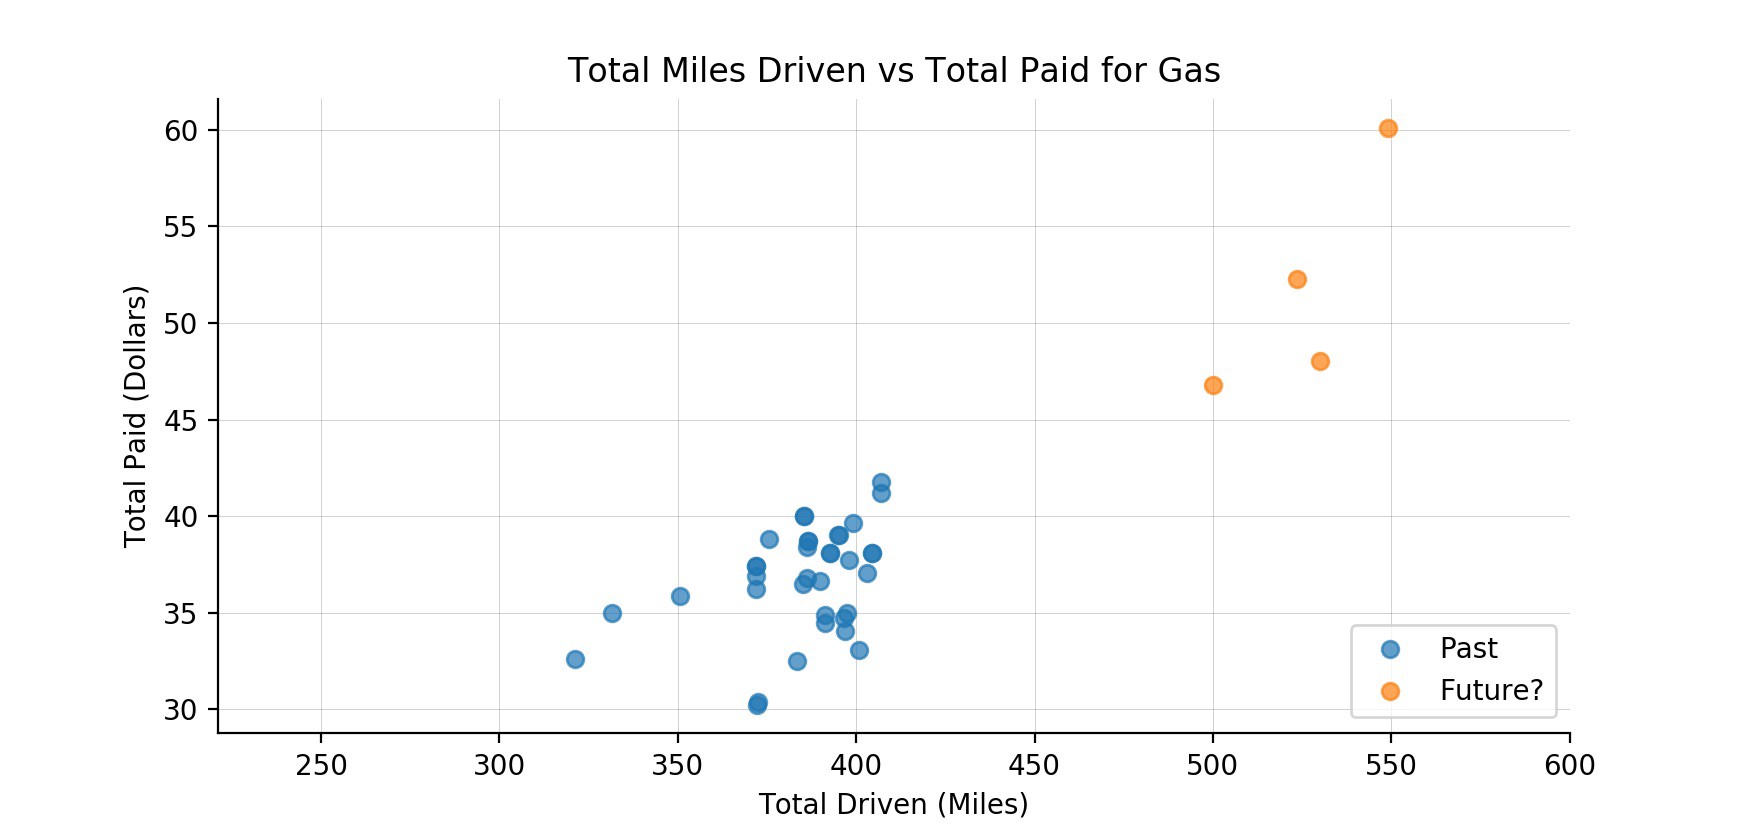
What you really want to figure out is: if I drive for 1200 miles, how much will I pay for gas?
In order to answer this question, you'll use the data you've been collecting so far, and use it to predict how much you are going to spend. The idea is that you can make estimated guesses about the future — your trip to Vegas — based on data from the past — the data points you've been laboriously logging.
You end up with a mathematical model that describes the relationship between miles driven and money spent to fill the tank.
Once that model is defined, you can provide it with new information — how many miles you're driving from San Francisco to Las Vegas — and the model will predict how much money you're going to need.
The model will use data from the past to learn about the relationship between the total miles driven and the total amount paid for gas.
When it's presented with a new data point — how many miles you drove from San Francisco to Las Vegas — the model will leverage on the knowledge it got from all the past data and provide its best guess — a prediction, i.e, your data point from the future.
Looking back at your data you see that usually, the more you spend on gas, the longer you can drive before running dry — assuming that the price of gas stays constant.
If you were to best describe — or "explain" — that relationship in the plot above, it would look somewhat like this:
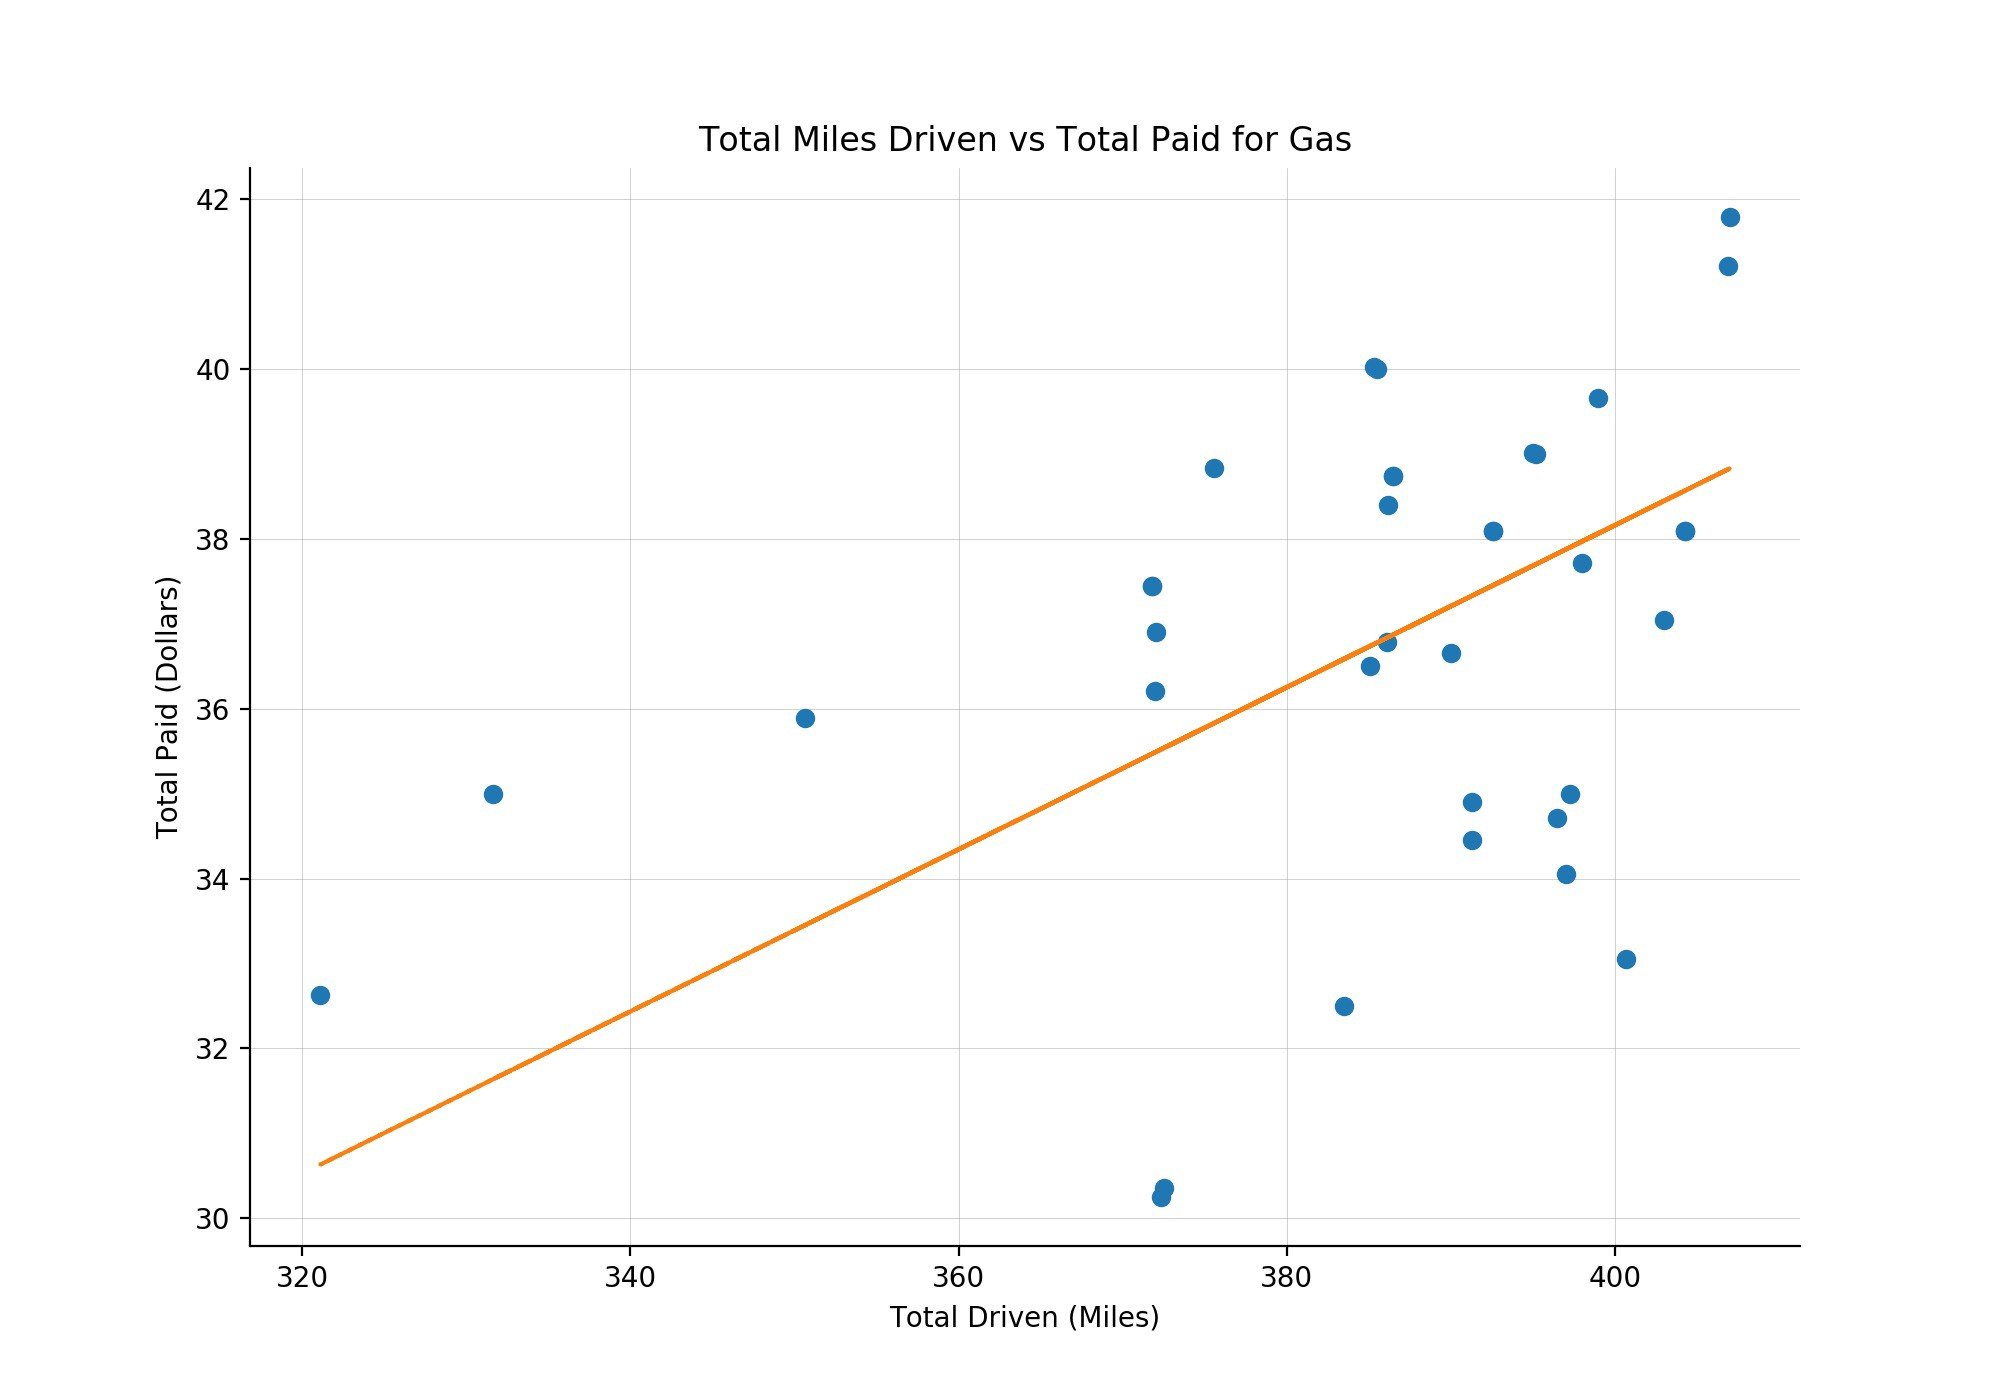
Clearly there is a linear relationship between miles driven and total paid for gas. Because this relationship is linear, if you spend less/more money — e.g. half vs full tank — you'll be able to drive fewer/more miles.
And because that relationship is linear and you know how long is your drive from San Francisco to Las Vegas, using a linear model will help you predict how much you are going to budget for gas.
Linear Regression Model
The type of model that best describes the relationship between total miles driven and total paid for gas is a Linear Regression Model. The "regression" bit is there because what you're trying to predict is a numerical value.
There are a few concepts to unpack here:
- Dependent Variable
- Independent Variable(s)
- Intercept
- Coefficients
The amount of money you'll have to budget for gas depends on how many miles you are going to drive, in this case, to go from San Francisco to Las Vegas. Thus, the total paid for gas is the dependent variable in the model.
On the other hand, Las Vegas isn't going anywhere, so how many miles you need to drive from San Francisco to Las Vegas is independent of the amount you pay at the gas station — miles driven is the independent variable in the model. Let's for a moment assume that price of gas remains constant.
Since we're only dealing with one independent variable, the model can be specified as:

This is a simple version of a linear combination, where there's only one variable. If you wanted to be more rigorous in your calculations you could also add the price of the oil barrel as an independent variable in this model, since it affects the price of gas.

With all the necessary pieces of the model in place, the only question that remains is: what about B0, B1 and B2?
B0, read "Beta 0", is the intercept of the model, meaning it's the value that your independent variable takes if every dependent variable equals to zero. You can visualize it as a straight line that goes through the origin of the axis.
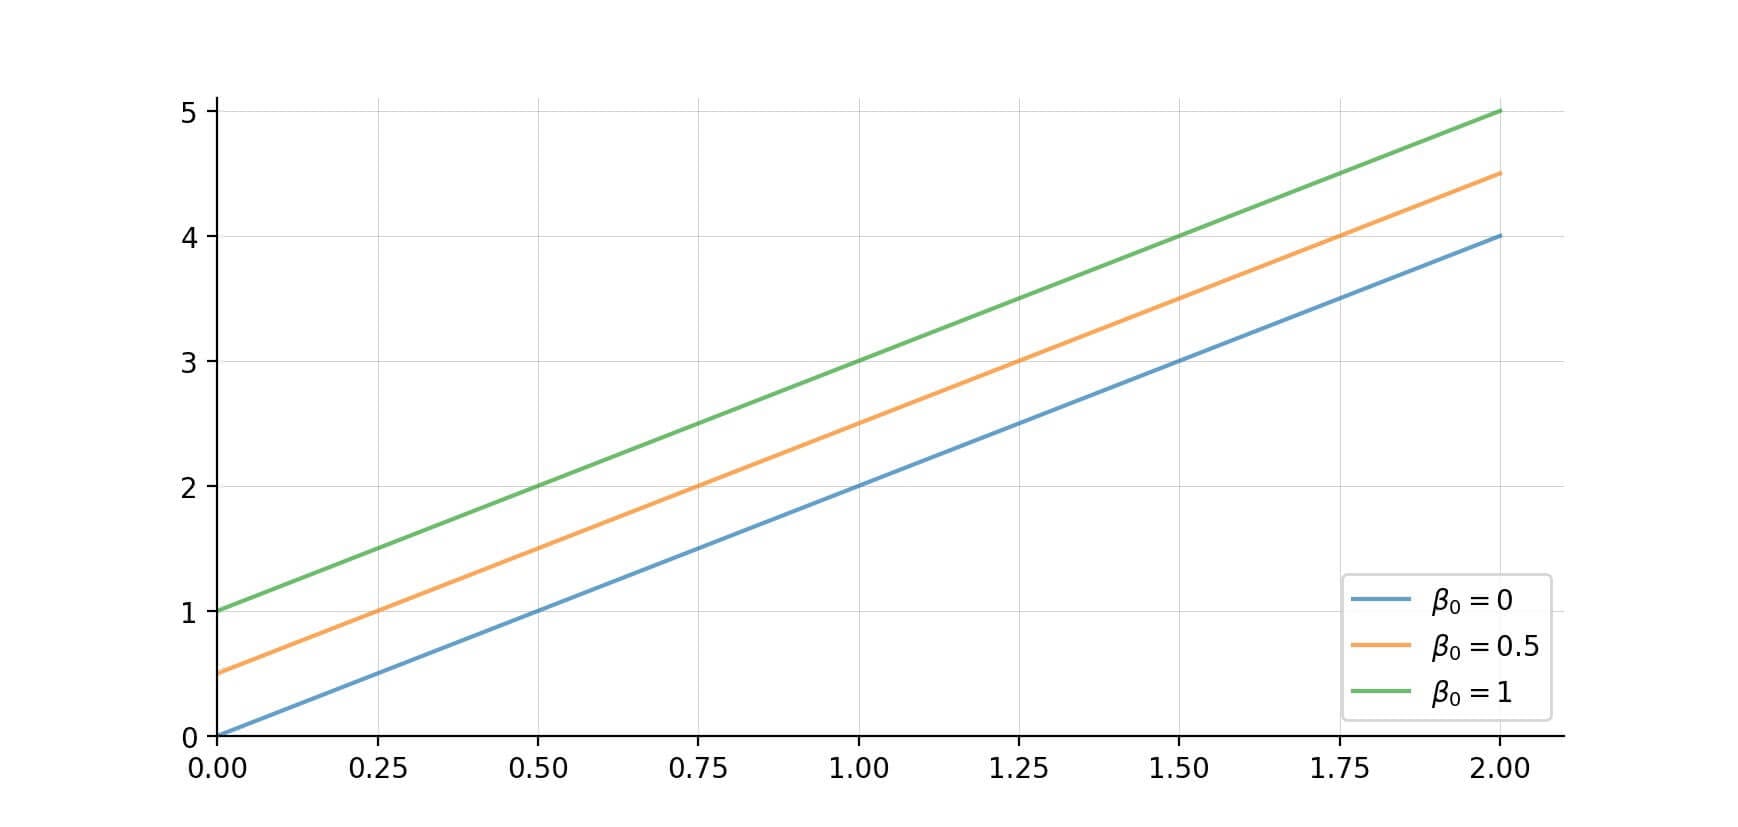 Different intercept values for the linear model: y = Beta0+ 2x
"Beta 1" and "Beta 2" are the called coefficients. You have one coefficient per each independent variable in your model. They determine the slope of your regression line, the line that describes your model.
If we take the example above, a model specified by y= Beta0 + Beta1x, and play around with different Beta 1 values, we have something like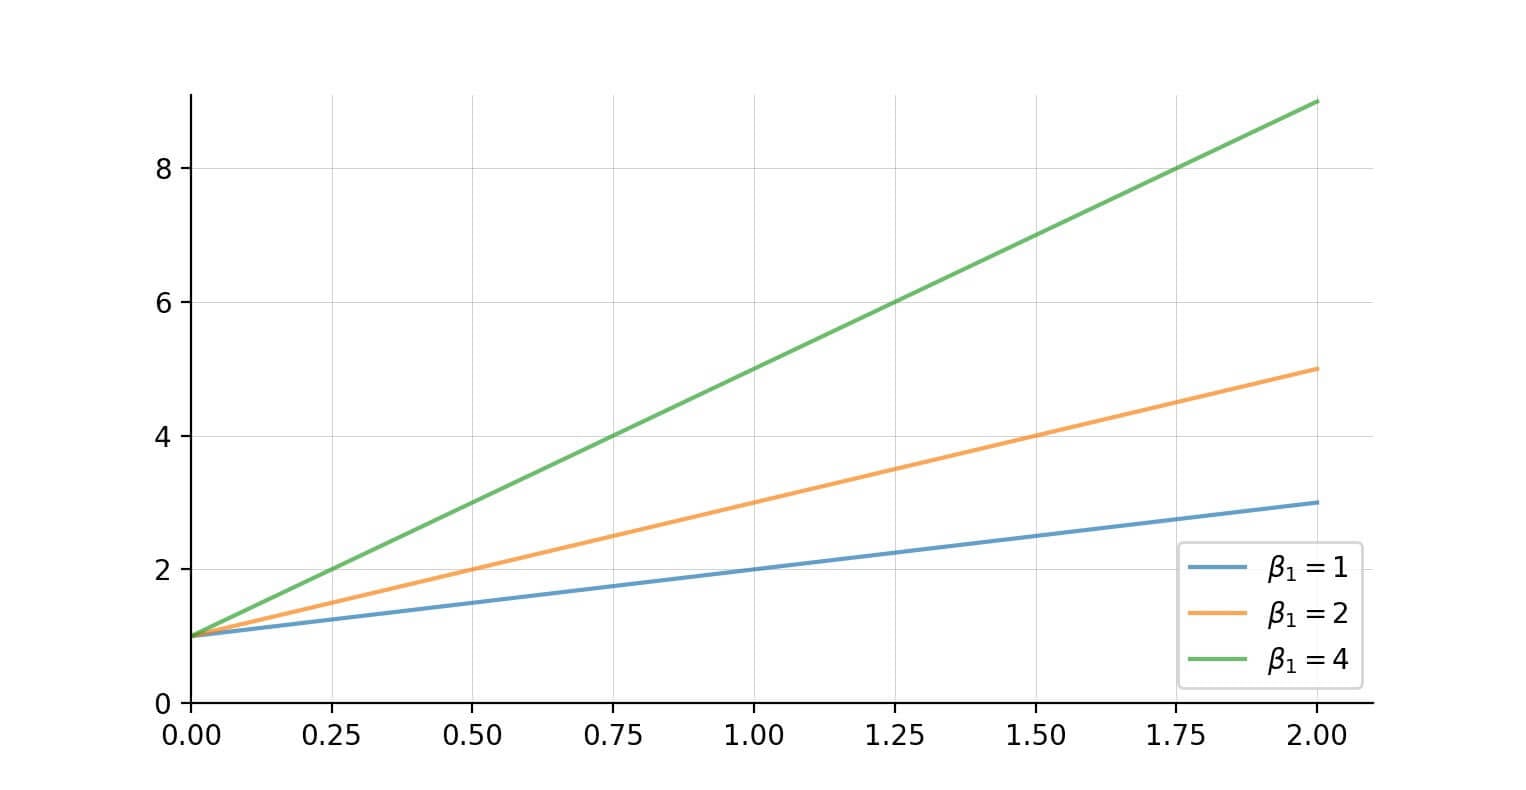 Different coefficient values for the linear model: y = 1 + Beta1x
The coefficients explain the rate of change of the dependent variable, the amount you'll pay in gas, as each independent variable change by one unit.
So, in the case of the blue line above, the dependent value y changes by a factor of 1, every time the independent variable x changes a unit.
For the green line, that effect is 4 times a unit change in the dependent variable x.
Ordinary Least Squares
At this point we've discussed the Linear model and even experimenting plugging in different values for both the intercept and the coefficient.
However, to figure out how much you're going to pay for gas on you trip to Las Vegas we need a mechanism to estimate those values.
There are different techniques to estimate the parameters of a model. One of the most popular is the Ordinary Least Squares (OLS).
The premise of the Ordinary Least Squares method is to minimize the sum of the squares of the residuals of the model. Which are the difference, think distance, between the predicted values and the actual values in the dataset .
This way the model is calculating the best parameters, so that each point in the regression line is as close as possible to the dataset.
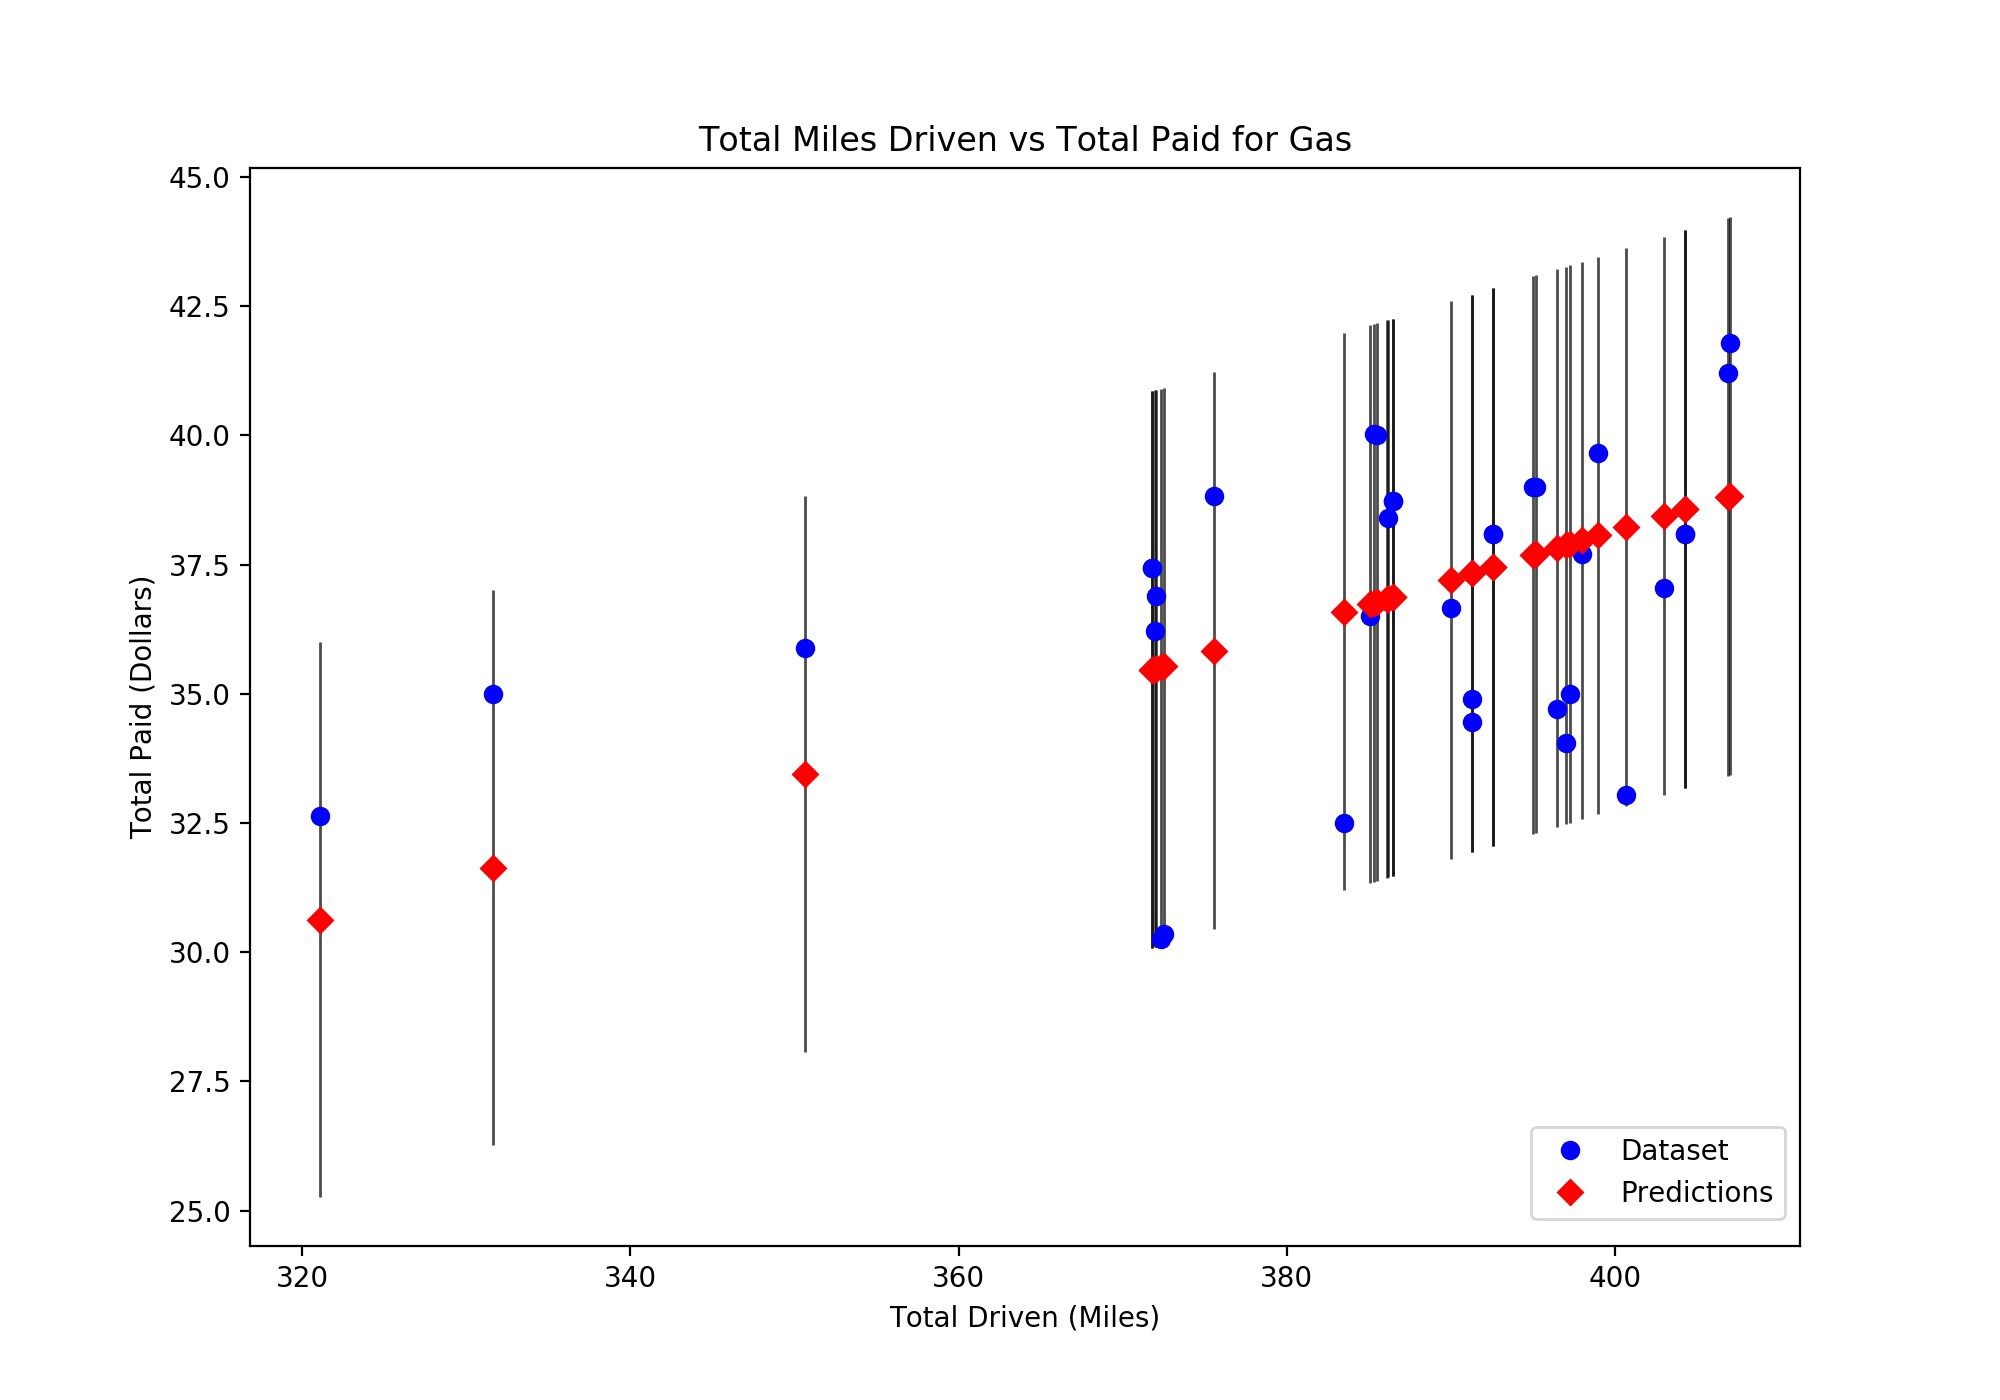
At the end of your budgeting exercise, having the model parameters, you can plug in the total miles you expect to drive and estimate how much you'll need to allocate for gas.

Great, now you know that you should budget $114.5 for gas!
(You'll notice that we don't have the parameter Beta 0 in our model. In our use case, having an intercept — or a constant value when our dependent variable is equal to zero — doesn't make much sense. For this specific model, we’re forcing it to go through the origin, because if you're not driving, you won't be spending any gas money.)
Next time you find yourself in a situation where you need to estimate a quantity based on a number of factors that can be described by a straight line — you know you can use a Linear Regression Model.
This post was written by Carolina Bento. She leads Data Analytics teams that empower companies to make data-driven decisions, and currently manages Product Analytics team at eero. This article was originally posted on Medium, and has been reposted with permission.